McClellan Study:
Snap Sampler returns the best comparisons... with the Snap Sampler.
The "McClellan Study" is a multi-agency test study conducted at the former Mc- Clellan Air Force Base in Sacramento, California. In the final report, Parsons describes the Snap Sampler as "...more consistently representative..."
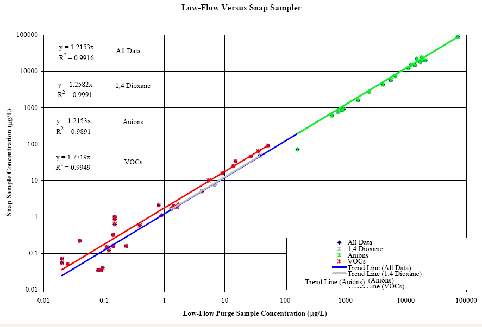
Correlation Coefficients (R2) for the Snap Sampler were the highest of all the methods tested compared to low flow and standard purge methods.
For VOCs:
Low Flow vs. Snap Sampler R2=0.99
Low Flow vs. others...R2= 0.96, 0.91, 0.79, 0.77, 0.76
3 Volume vs Snap Sampler R2= 0.90
3 Volume vs. others...R2= 0.76, 0.75, 0.70, 0.58, 0.50, 0.33
For all Analytes:
Low Flow vs. Snap Sampler R2 = 0.99
3 Volume vs. Snap Sampler R2 = 0.99
A close comparison makes technology conversion much easier:
for regulatory acceptance
for trend continuity
Both are critically important.
Here is an example of a McClellan data plot:

Download the entire report and figures here: